 Web Server Statistics for arhbaum.freeshell.org
Program started at Wed-23-Jan-2008 23:13.
Analysed requests from Wed-23-Jan-2008 12:11 to Wed-23-Jan-2008 22:53 (0.45 days).
Web Server Statistics for arhbaum.freeshell.orgProgram started at Wed-23-Jan-2008 23:13.
Analysed requests from Wed-23-Jan-2008 12:11 to Wed-23-Jan-2008 22:53 (0.45 days).
(Go To: Top | General Summary | Monthly Report | Daily Summary | Hourly Summary | Domain Report | Organisation Report | Status Code Report | File Size Report | File Type Report | Directory Report | Request Report)
This report contains overall statistics.
Successful requests: 72
Average successful requests per day: 159
Successful requests for pages: 13
Average successful requests for pages per day: 26
Failed requests: 34
Redirected requests: 27
Distinct files requested: 2
Distinct hosts served: 35
Data transferred: 158.81 megabytes
Average data transferred per day: 356.22 megabytes
(Go To: Top | General Summary | Monthly Report | Daily Summary | Hourly Summary | Domain Report | Organisation Report | Status Code Report | File Size Report | File Type Report | Directory Report | Request Report)
This report lists the activity in each month.
Each unit ( ) represents 1 request for a page.
| month | reqs | pages | |
|---|---|---|---|
| Jan 2008 | 72 | 13 |   |
Busiest month: Jan 2008 (13 requests for pages).
(Go To: Top | General Summary | Monthly Report | Daily Summary | Hourly Summary | Domain Report | Organisation Report | Status Code Report | File Size Report | File Type Report | Directory Report | Request Report)
This report lists the total activity for each day of the week, summed over all the weeks in the report.
Each unit () represents 1 request for a page.
| day | reqs | pages | |
|---|---|---|---|
| Sun | 0 | 0 | |
| Mon | 0 | 0 | |
| Tue | 0 | 0 | |
| Wed | 72 | 13 | |
| Thu | 0 | 0 | |
| Fri | 0 | 0 | |
| Sat | 0 | 0 |
(Go To: Top | General Summary | Monthly Report | Daily Summary | Hourly Summary | Domain Report | Organisation Report | Status Code Report | File Size Report | File Type Report | Directory Report | Request Report)
This report lists the total activity for each hour of the day, summed over all the days in the report.
Each unit () represents 1 request for a page.
| hour | reqs | pages | |
|---|---|---|---|
| 0 | 0 | 0 | |
| 1 | 0 | 0 | |
| 2 | 0 | 0 | |
| 3 | 0 | 0 | |
| 4 | 0 | 0 | |
| 5 | 0 | 0 | |
| 6 | 0 | 0 | |
| 7 | 0 | 0 | |
| 8 | 0 | 0 | |
| 9 | 0 | 0 | |
| 10 | 0 | 0 | |
| 11 | 0 | 0 | |
| 12 | 3 | 2 |  |
| 13 | 8 | 2 | |
| 14 | 2 | 0 | |
| 15 | 17 | 3 | |
| 16 | 12 | 2 | |
| 17 | 10 | 0 | |
| 18 | 10 | 2 | |
| 19 | 0 | 0 | |
| 20 | 9 | 1 | |
| 21 | 0 | 0 | |
| 22 | 1 | 1 | |
| 23 | 0 | 0 |
(Go To: Top | General Summary | Monthly Report | Daily Summary | Hourly Summary | Domain Report | Organisation Report | Status Code Report | File Size Report | File Type Report | Directory Report | Request Report)
This report lists the countries of the computers which requested files.
Listing domains, sorted by the amount of traffic.
| reqs | %bytes | domain |
|---|---|---|
| 72 | 100% | [unresolved numerical addresses] |
(Go To: Top | General Summary | Monthly Report | Daily Summary | Hourly Summary | Domain Report | Organisation Report | Status Code Report | File Size Report | File Type Report | Directory Report | Request Report)
This report lists the organisations of the computers which requested files.

Listing organisations, sorted by the number of requests.
| reqs | %bytes | organisation |
|---|---|---|
| 11 | 11.24% | 69 |
| 11 | 7.23% | 209.51 |
| 6 | 10.21% | 71 |
| 5 | 5.99% | 72 |
| 4 | 3.49% | 68.17 |
| 4 | 7.54% | 70 |
| 2 | 3.70% | 128.151 |
| 2 | 1.23% | 66.81 |
| 2 | 3.49% | 68.52 |
| 2 | 3.53% | 68.38 |
| 2 | 3.58% | 199.235 |
| 2 | 3.49% | 38 |
| 2 | 4.08% | 75 |
| 2 | 1.04% | 85 |
| 2 | 3.62% | 144.91 |
| 2 | 3.49% | 208.39 |
| 2 | 0.57% | 122 |
| 2 | 3.82% | 67.194 |
| 1 | 3.49% | 165.106 |
| 1 | 3.49% | 192.152 |
| 1 | 3.49% | 68.80 |
| 1 | 0.98% | 190.138 |
| 1 | 3.49% | 129.174 |
| 1 | 3.49% | 67.84 |
| 1 | 0.20% | 204.15 |
(Go To: Top | General Summary | Monthly Report | Daily Summary | Hourly Summary | Domain Report | Organisation Report | Status Code Report | File Size Report | File Type Report | Directory Report | Request Report)
This report lists the HTTP status codes of all requests.
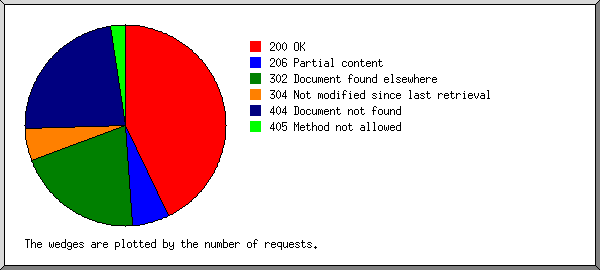
Listing status codes, sorted numerically.
| reqs | status code |
|---|---|
| 57 | 200 OK |
| 8 | 206 Partial content |
| 27 | 302 Document found elsewhere |
| 7 | 304 Not modified since last retrieval |
| 31 | 404 Document not found |
| 3 | 405 Method not allowed |
(Go To: Top | General Summary | Monthly Report | Daily Summary | Hourly Summary | Domain Report | Organisation Report | Status Code Report | File Size Report | File Type Report | Directory Report | Request Report)
This report lists the sizes of files.
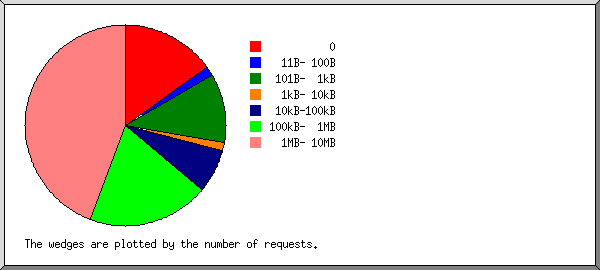
| size | reqs | %bytes |
|---|---|---|
| 0 | 11 | |
| 1B- 10B | 0 | |
| 11B- 100B | 1 | |
| 101B- 1kB | 8 | |
| 1kB- 10kB | 1 | |
| 10kB-100kB | 5 | 0.12% |
| 100kB- 1MB | 14 | 4.48% |
| 1MB- 10MB | 32 | 95.40% |
(Go To: Top | General Summary | Monthly Report | Daily Summary | Hourly Summary | Domain Report | Organisation Report | Status Code Report | File Size Report | File Type Report | Directory Report | Request Report)
This report lists the extensions of files.
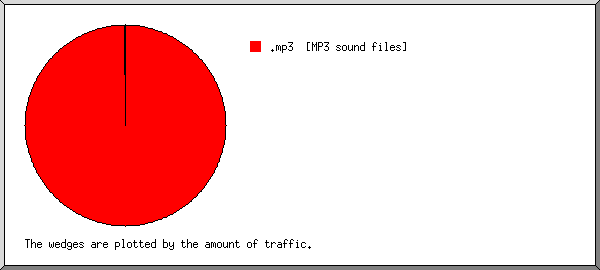
Listing extensions with at least 0.1% of the traffic, sorted by the amount of traffic.
| reqs | %bytes | extension |
|---|---|---|
| 59 | 100% | .mp3 [MP3 sound files] |
| 13 | [not listed: 1 extension] |
(Go To: Top | General Summary | Monthly Report | Daily Summary | Hourly Summary | Domain Report | Organisation Report | Status Code Report | File Size Report | File Type Report | Directory Report | Request Report)
This report lists the directories from which files were requested. (The figures for each directory include all of its subdirectories.)
Listing directories with at least 0.01% of the traffic, sorted by the amount of traffic.
| reqs | %bytes | directory |
|---|---|---|
| 72 | 100% | [root directory] |
(Go To: Top | General Summary | Monthly Report | Daily Summary | Hourly Summary | Domain Report | Organisation Report | Status Code Report | File Size Report | File Type Report | Directory Report | Request Report)
This report lists the files on the site.
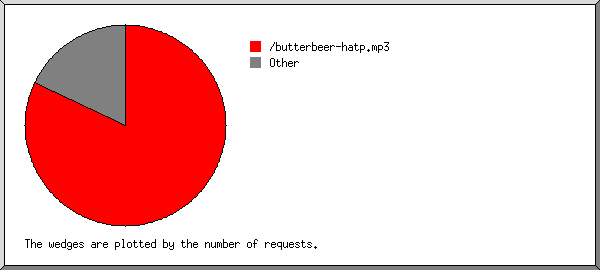
Listing files with at least 20 requests, sorted by the number of requests.
| reqs | %bytes | last time | file |
|---|---|---|---|
| 59 | 100% | 23/Jan/08 20:34 | /butterbeer-hatp.mp3 |
| 13 | 23/Jan/08 22:22 | [not listed: 1 file] |